By the mean?
Most statistics are useful if you take the same number of measurements (IOP exams) each day at the same times each day. Your chart shows IOP exam times like 9:53, so I doubt you are doing this. (I don't do it either.)
However, if you do not do the above, you could accomplish the same result if include only a set of pre-defined measures in your mean. Don't pick the measures you like best each day. Follow a pre-defined method. Decide which IOP exams will be included for your daily statistics and stick to that definition each day.
For example, you could use your "upon awakening" IOP, your "before lunch" IOP, your "after workout" IOP and your "bedtime" IOP to calculate your mean (and other statistics such as range or standard deviation) each day.
Those IOP exams should be done the same way each day. Don't miss any of these IOP exams or your statistics for that day will be biased. (If that happens, either exclude that day from your trend, or include it but add a note that is may be biased.)
By the fraction within the target range?
Same answer as above
By the max?
Yes, this is meaningful.
By one key IOP exam each day?
This is very similar to "By the max." For many people it could be sufficient to follow the trend of the "upon awakening" IOP. Or, if you have identified a consistent time of day when your IOP peaks, create a trend chart of this specific IOP exam over time.
By the daily range?
It is important but it does not distinguish between an increased range due to elevated IOP vs one due to reduced IOP.
You can find more ideas here:
What methodology should I use for self-tonometry to detect if there is a difference in IOP between two different glaucoma medications? | Ask FitEyes


I now have a lot of data over a 6 month period since I started with the FitEyes software (which I really appreciate and am grateful for). So I’m thinking that the trend (whether rising or plateauing or decreasing) is really more important than a 2-point difference at a particular time on a part day. To clarify, if my measurements are trending down over time, then isn’t that a more important piece of information than a 2-3 point difference on a particular time on a particular day? Wouldn’t that be a reliable indication that the changes I’ve made are working to regulate my IOP?
Yes, I think the trend is the important thing. You are correct. However, some people (e.g., retired engineers) may want to be extra rigorous in how they construct that trend.
Hi, thanks, got it. But. . .
I cannot regiment my day to the degree you describe. Too many uncontrollable variables like "hard work" at variable hours and for variable duration which frequently obliterates lunch, etc.
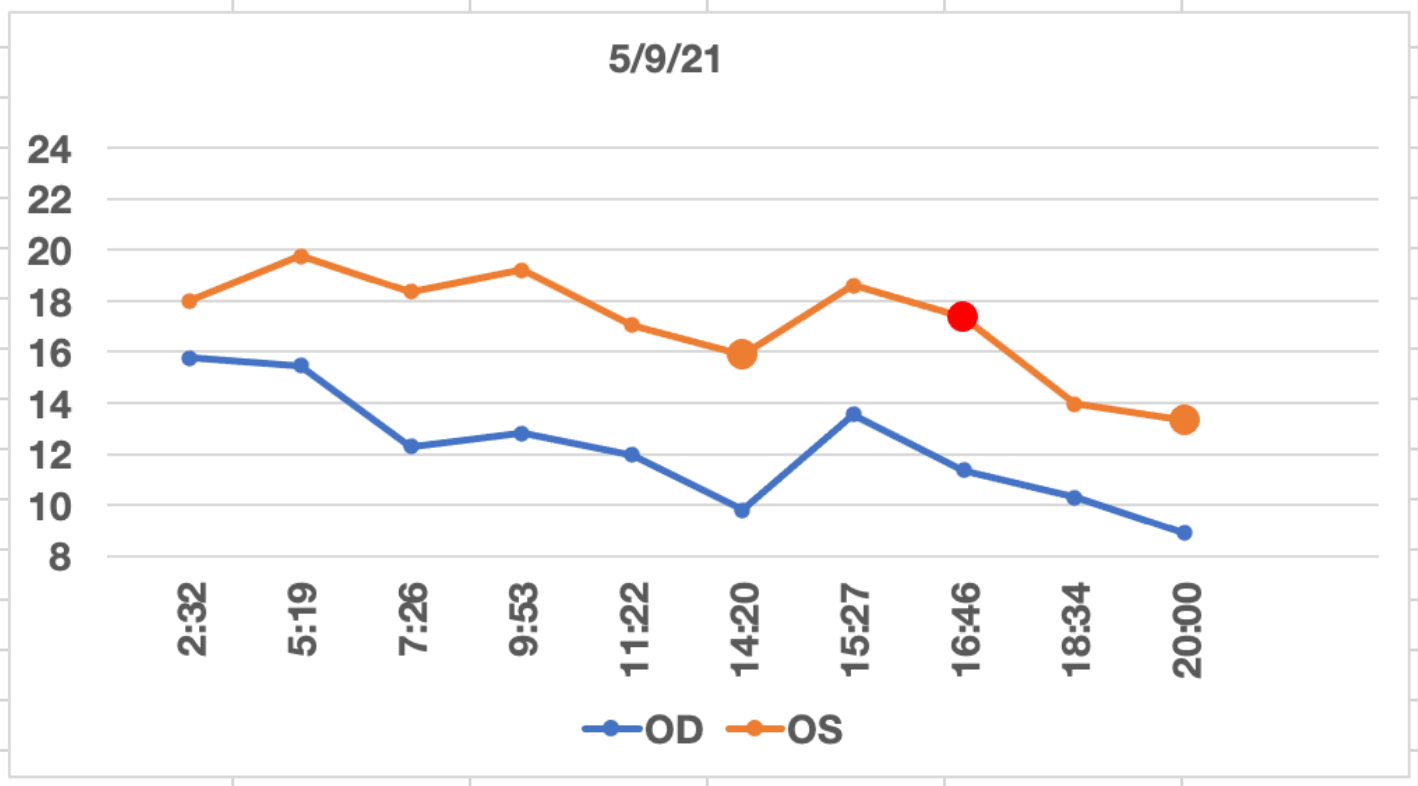
You been round the block couple of times so try this (see graph below).
I put targets on the graph. Then if lotsa points above the target, was a "bad day". If lotsa points below target, was a "good day". Could even get a single number, i.e. fraction of points above target.
As an aside, I have no idea what happened at 13:24 and 14:06. It was bilateral.
Loren
Your method introduces a bias. For example, all you have to do to turn a bad day into an OK day is to take a lot of measurements when your IOP is lower. For example, in the chart above, if you take more measurements around 20:00 to 21:00, your fraction of points above your target will go down. You can make it go down dramatically just by taking more measurements at other times of the day.
That's why I suggested in my answer that you use a et of pre-defined measures to create your "good/bad" summary statistic. You don't need to have a regimented schedule in order to do this. But you do should specify, for example, that you only include X number of IOP measurements between the hours of 18:00 and 23:59.
That's why I said the following in my answer:
You can also add to that your peak IOP value each day regardless of the time it occurred. That combination sounds like the best solution for you.
Thank you.
Is true successive, redundant measurements would skew sd and % in target range.
Of course one could take as many measurements as seemed interesting during the day but then prior to analysis remove all those that did not contribute new information, all those that were simply a duplicate of the prior value.
Include only those at inflection points. Then the graph above would look like this.
.
Thank you.
As far as I know, the method you described here will create biased statistics. Example: you check IOP every hour for 16 hours and your IOP is 12 each time except at noon when it is 15. Your method would translate 17 measurements into three: 12-15-12. Does that translated result imply that your IOP was 15 one-third of the time? Do mean, median or mode work now? Range remains valid, but most other statistics would be biased. I'm going to say that what you describe is not a valid statistical method.
Thank you for discussion; interesting; fun
True, the dataset you describe would be so skewed as to be meaningless. The remove at inflection method does remove valid IOP data
So
I reread your comments up top, the post on types of methodology, and the post on how to detect differences
For this daily evaluation I will do as you suggested up top
Define the day as wake, midmorning, noon, mid-afternoon, supper and bedtime. Use these values for the daily evaluation/statistics. Sort of a simplified version of “engineer”
I will keep “what is going on?” points, “night time points”, and “research” points out of the daily statistics.
As for the actual evaluation, I will just look at mean max min range and %below target and merely ask “is it status quo”, “why did it go up/down?” or “oh oh, gotta do something”.
Thanks again for the ideas
Loren
this then is yesterday, scored it "status quo" based upon historical data
Loren, this looks good.